Table of Contents
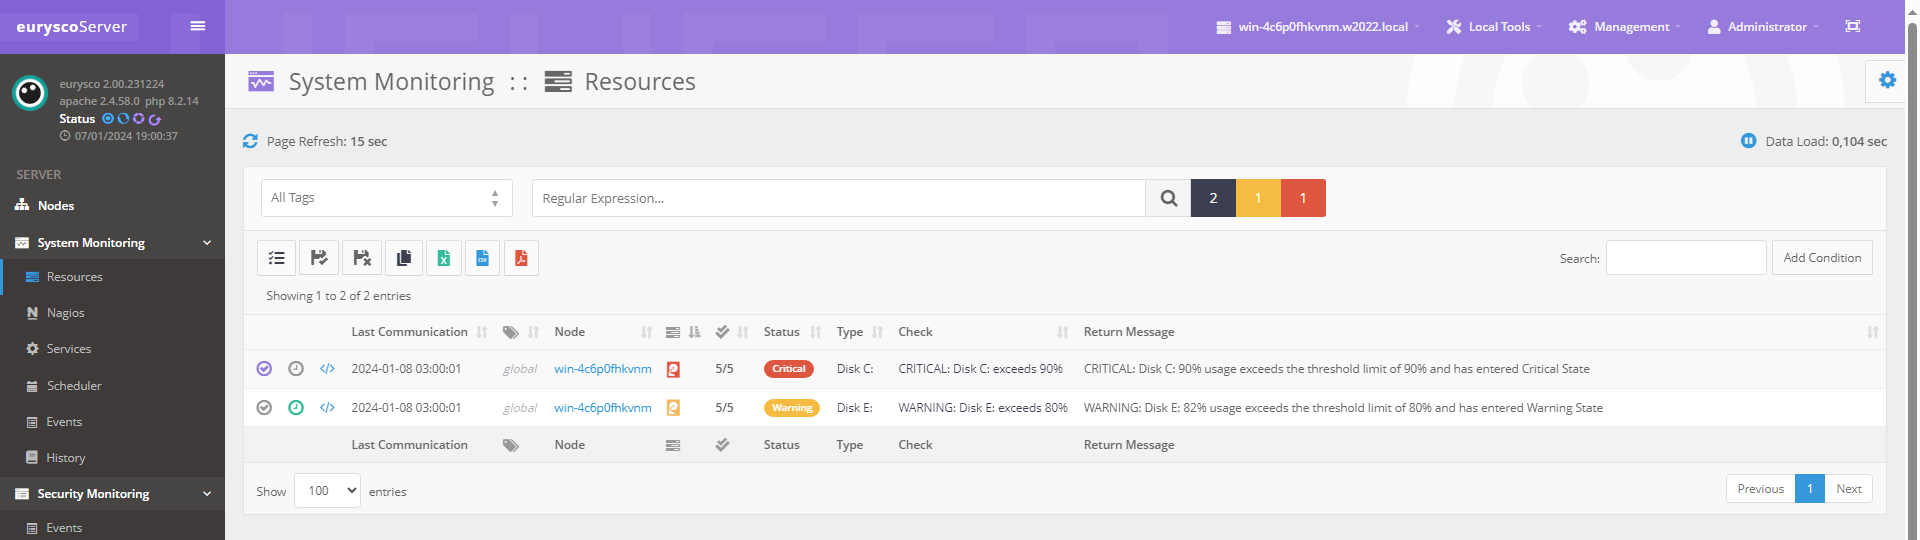
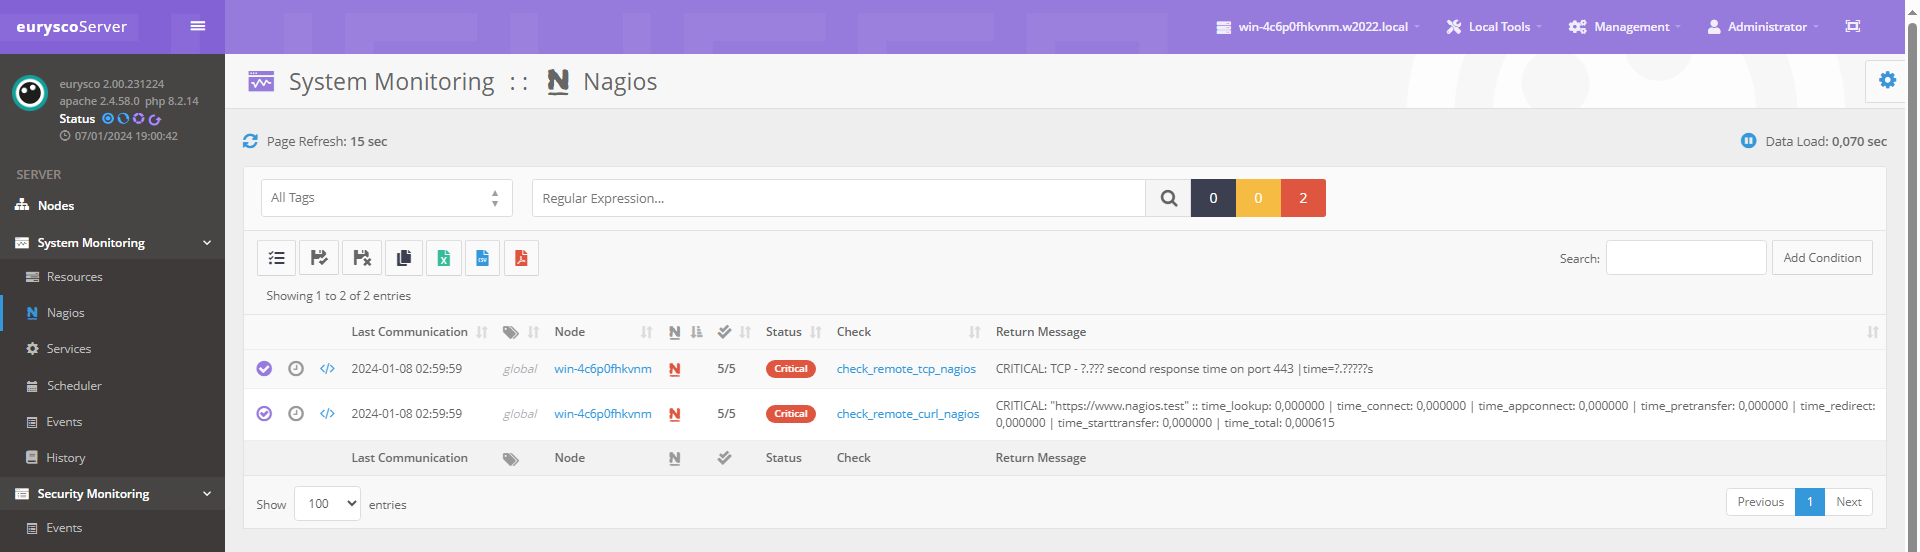
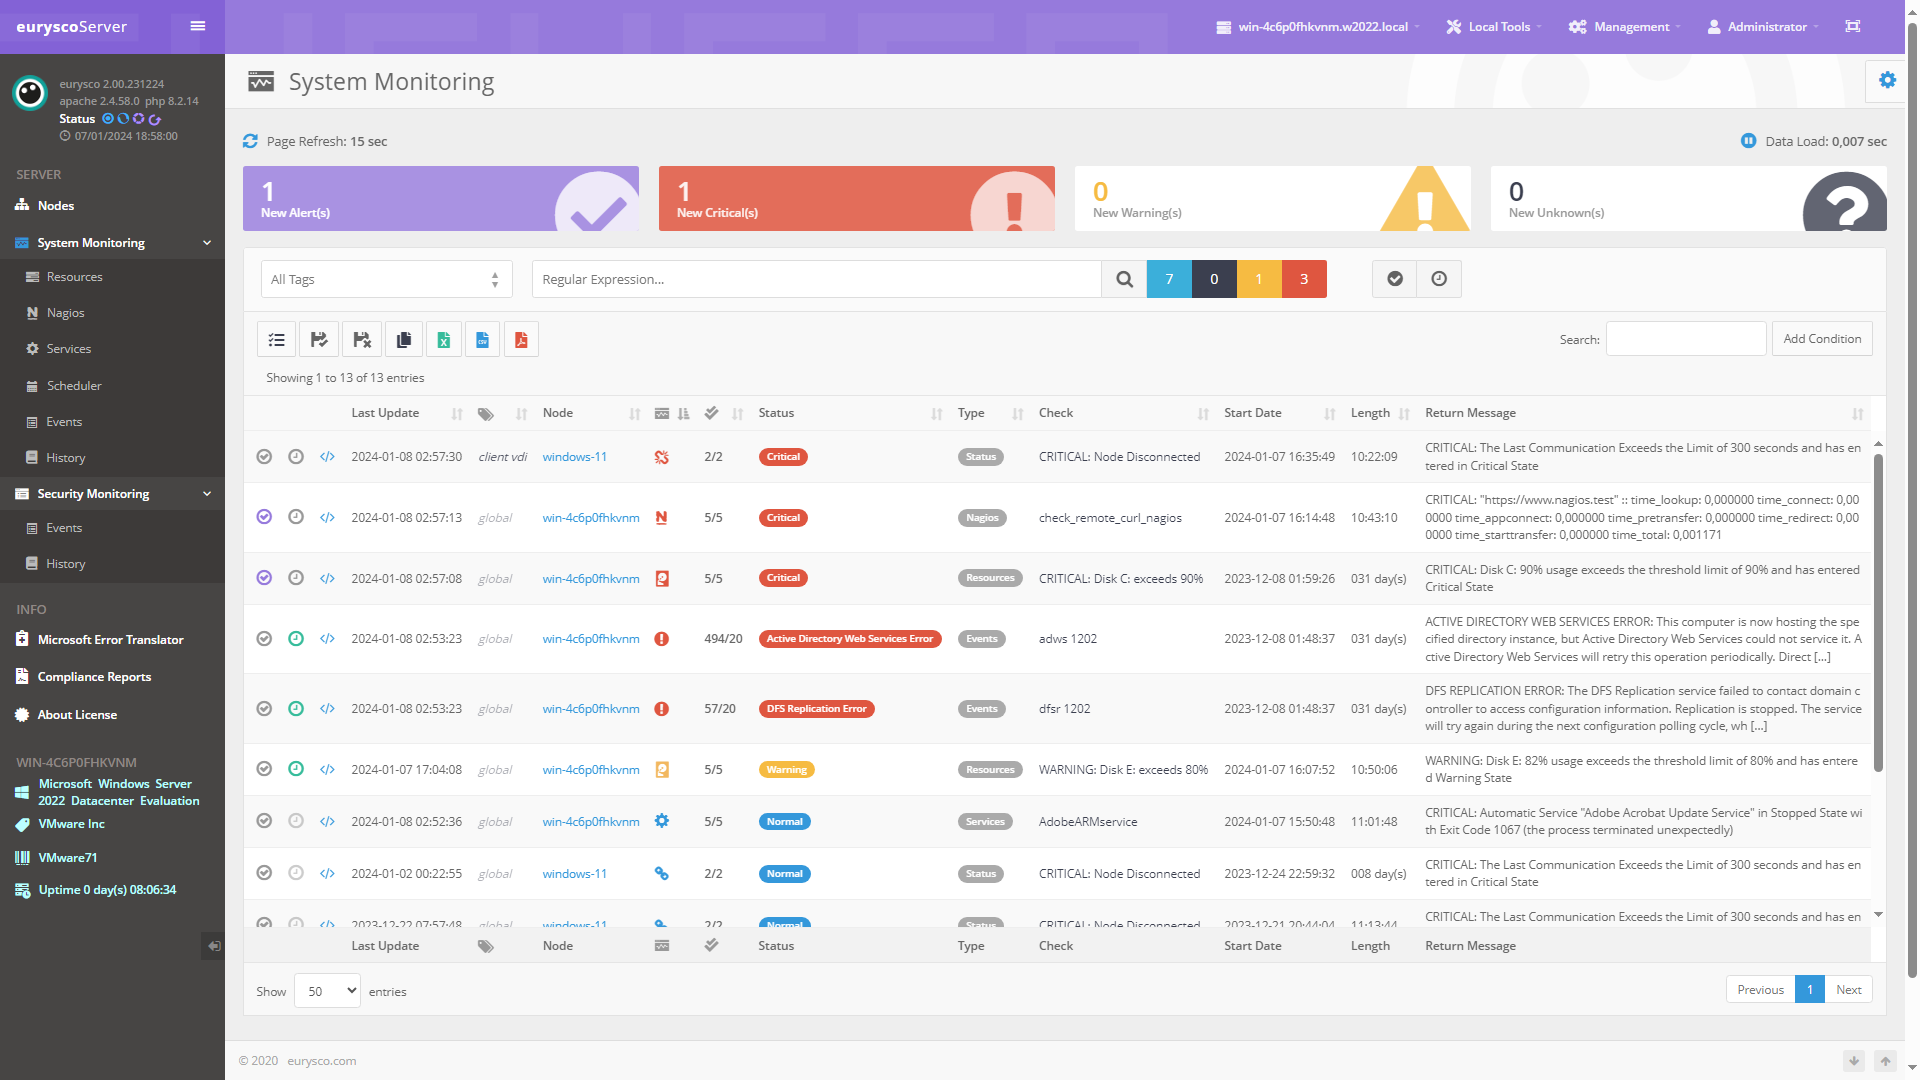
Interface that aggregates the status of all system alarms of eurysco nodes including hard state, acknowledge, downtime and remediation mechanisms.
-
-
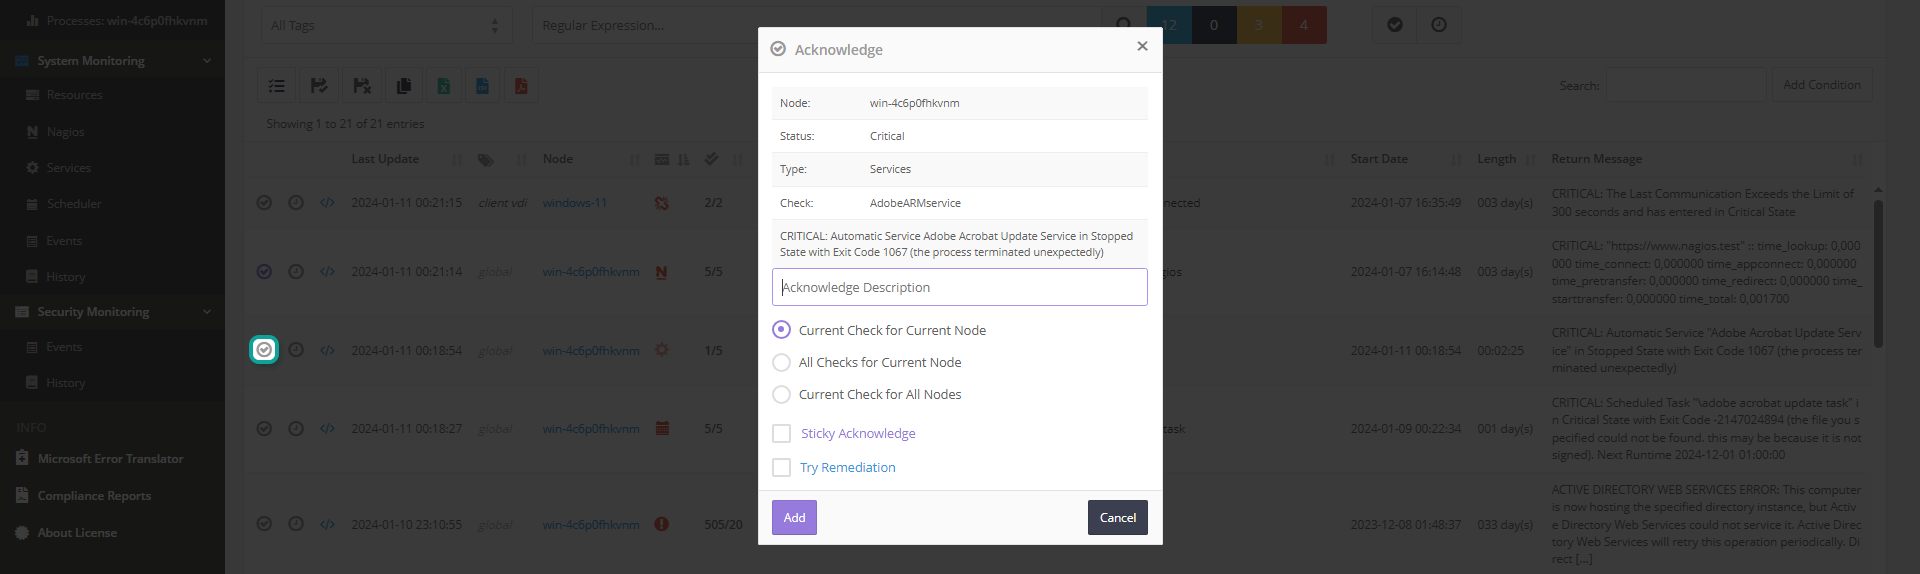
Acknowledge #
Acknowledgment is necessary to indicate that the alarm has been seen and that someone is working to resolve the detected problem:
- Description: Text field to add notes, reference tickets and useful information.
- Current Check for Current Node: Acknowledge this specific alarm in this specific node (default).
- All Checks for Current Node: Acknowledge all alarms in this specific node.
- Current Check for All Nodes: Acknowledge this alarm in all nodes.
- Sticky Acknowledge: Acknowledge the alarm permanently.
- Try Remediation: Try remediation by relaunching in case of system service or scheduled task.
-
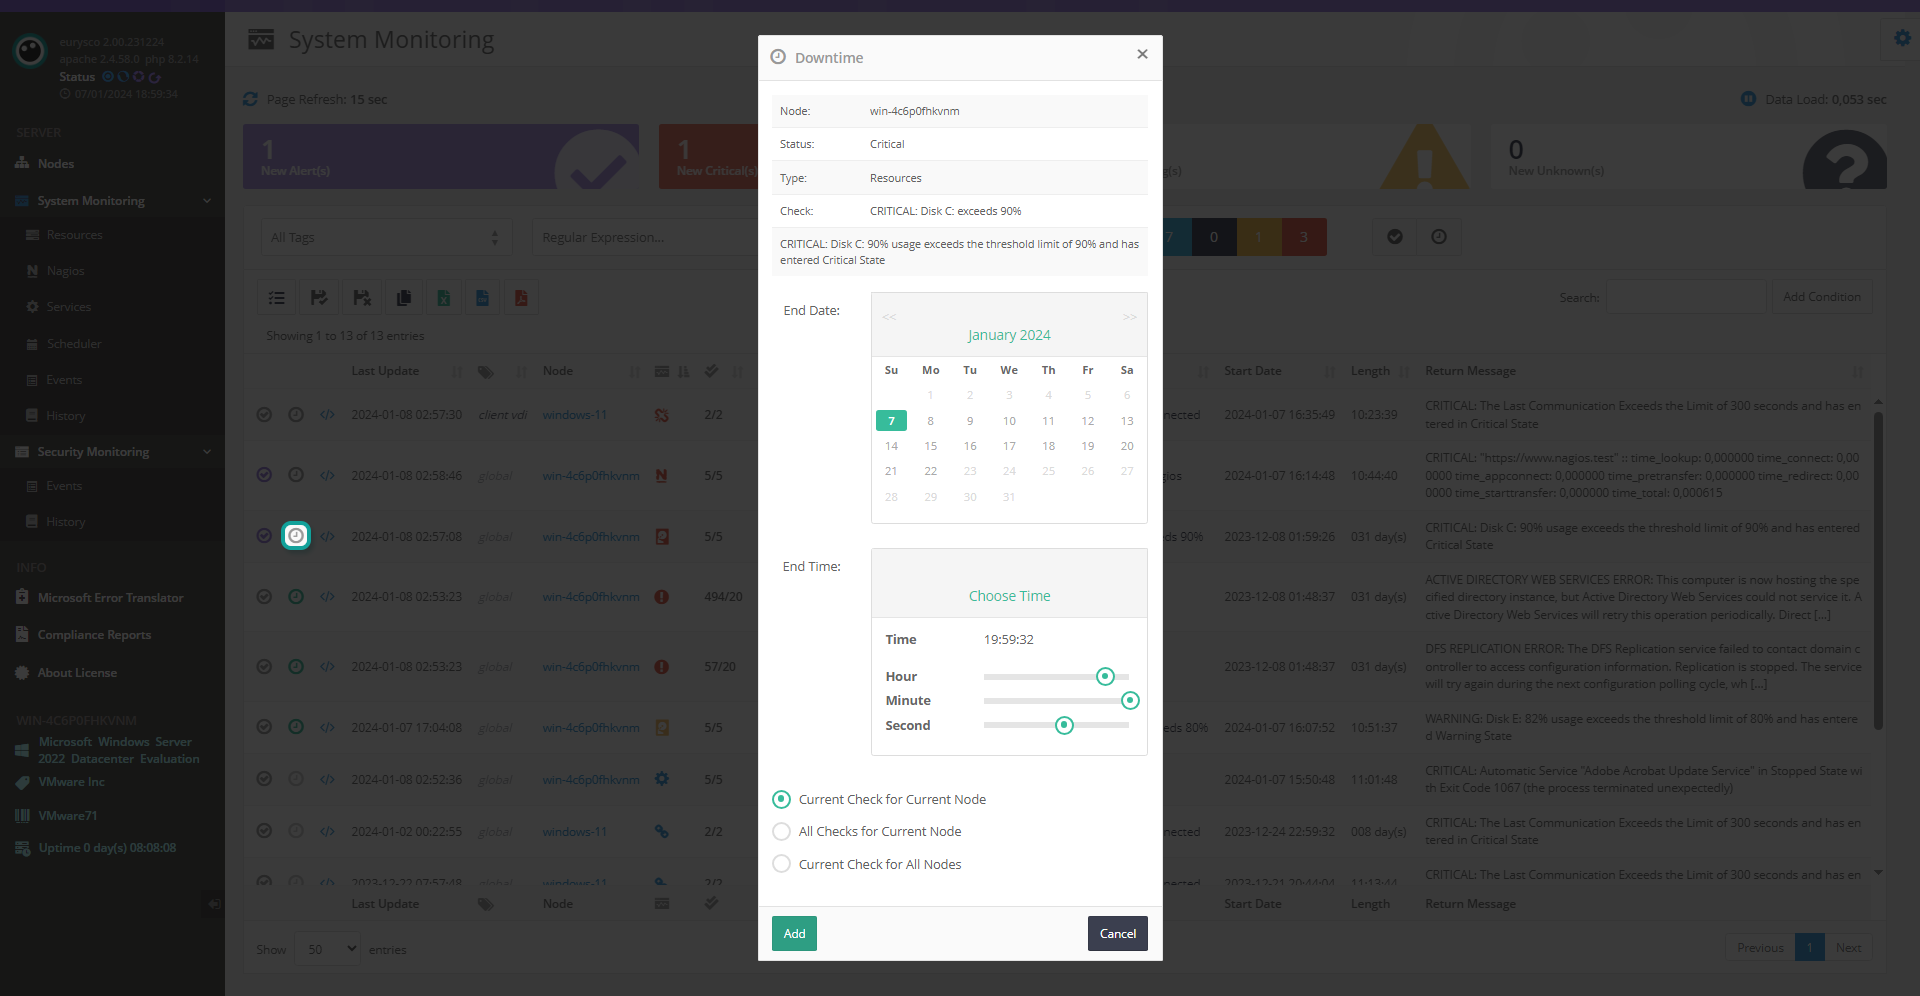
Downtime #
The preventive downtime of one or more alarms avoids unnecessary technical interventions, for example during planned activities:
- Current Check for Current Node: Acknowledge this specific alarm in this specific node (default).
- All Checks for Current Node: Acknowledge all alarms in this specific node.
- Current Check for All Nodes: Acknowledge this alarm in all nodes.
-
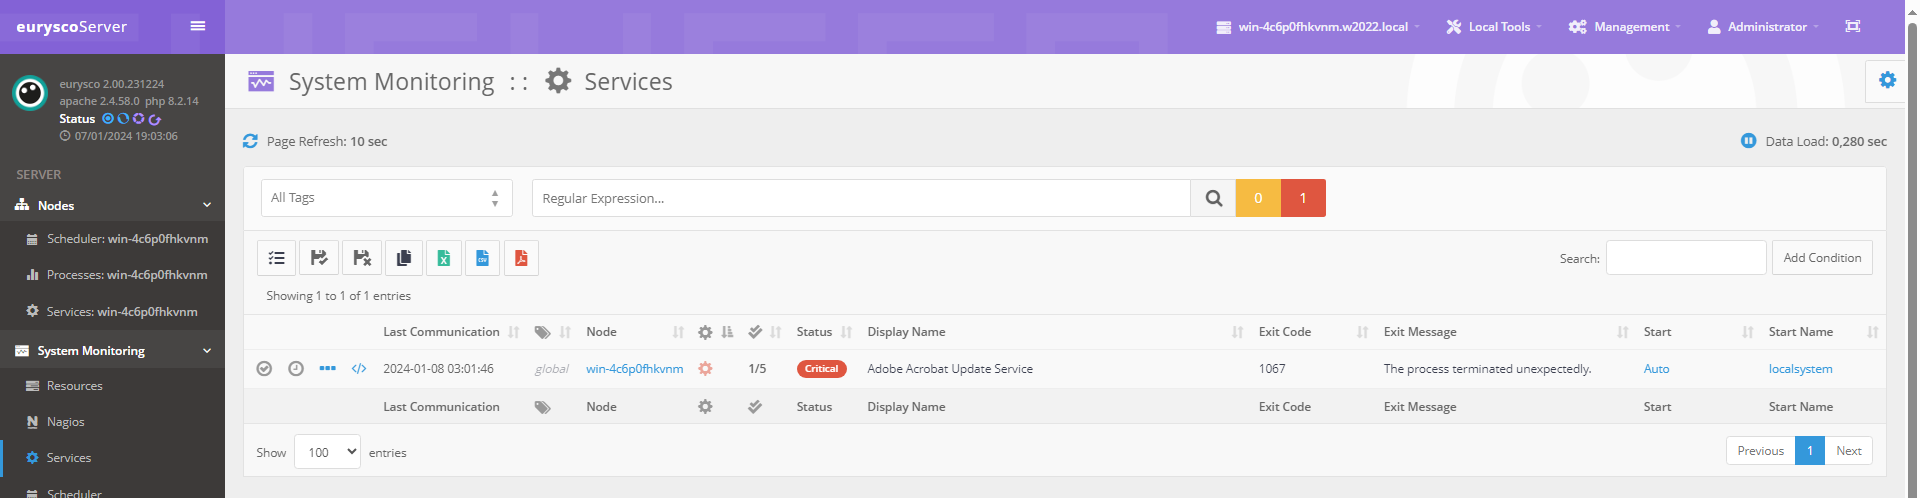
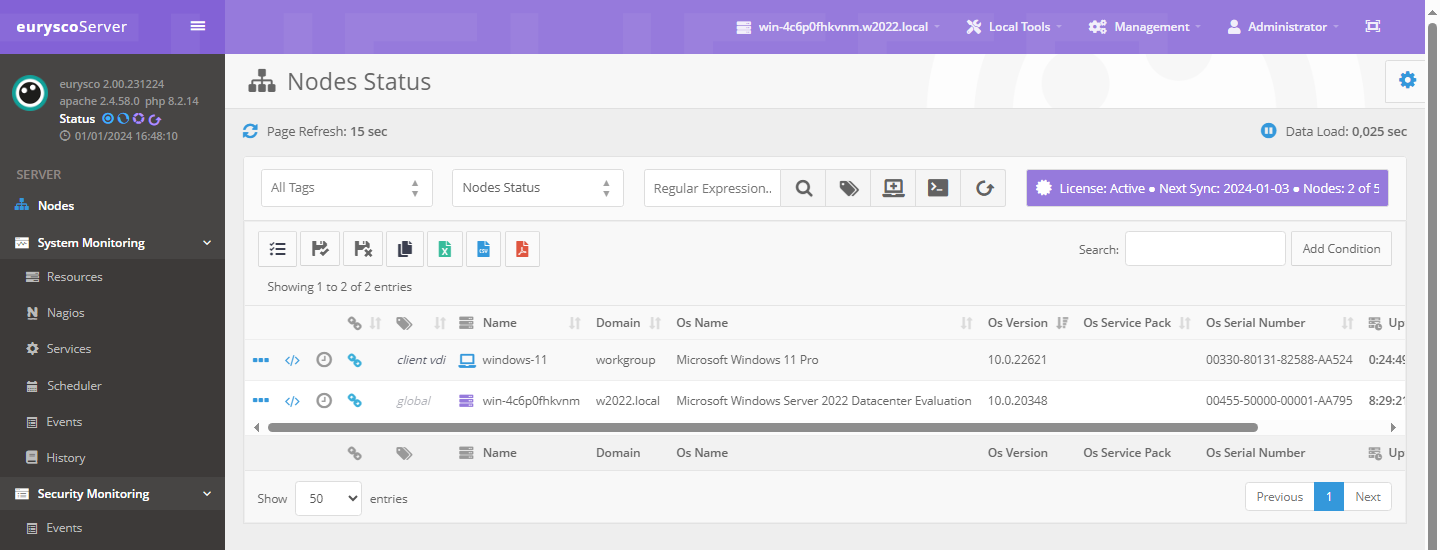
Operating System #
-
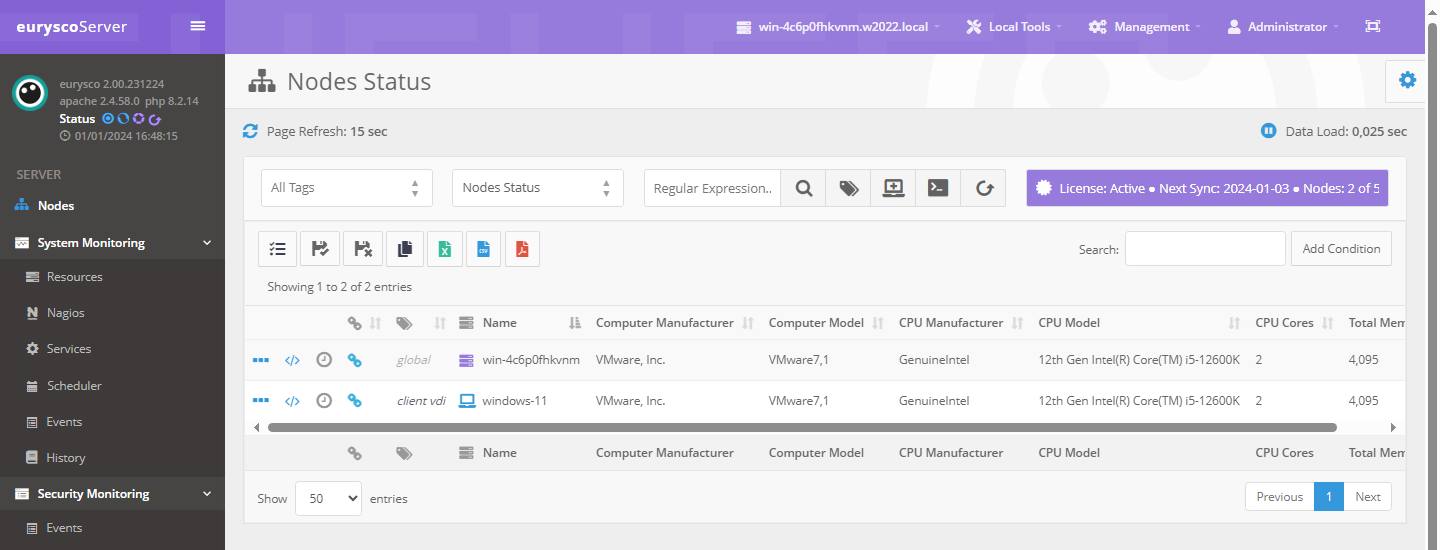
Computer System #
-
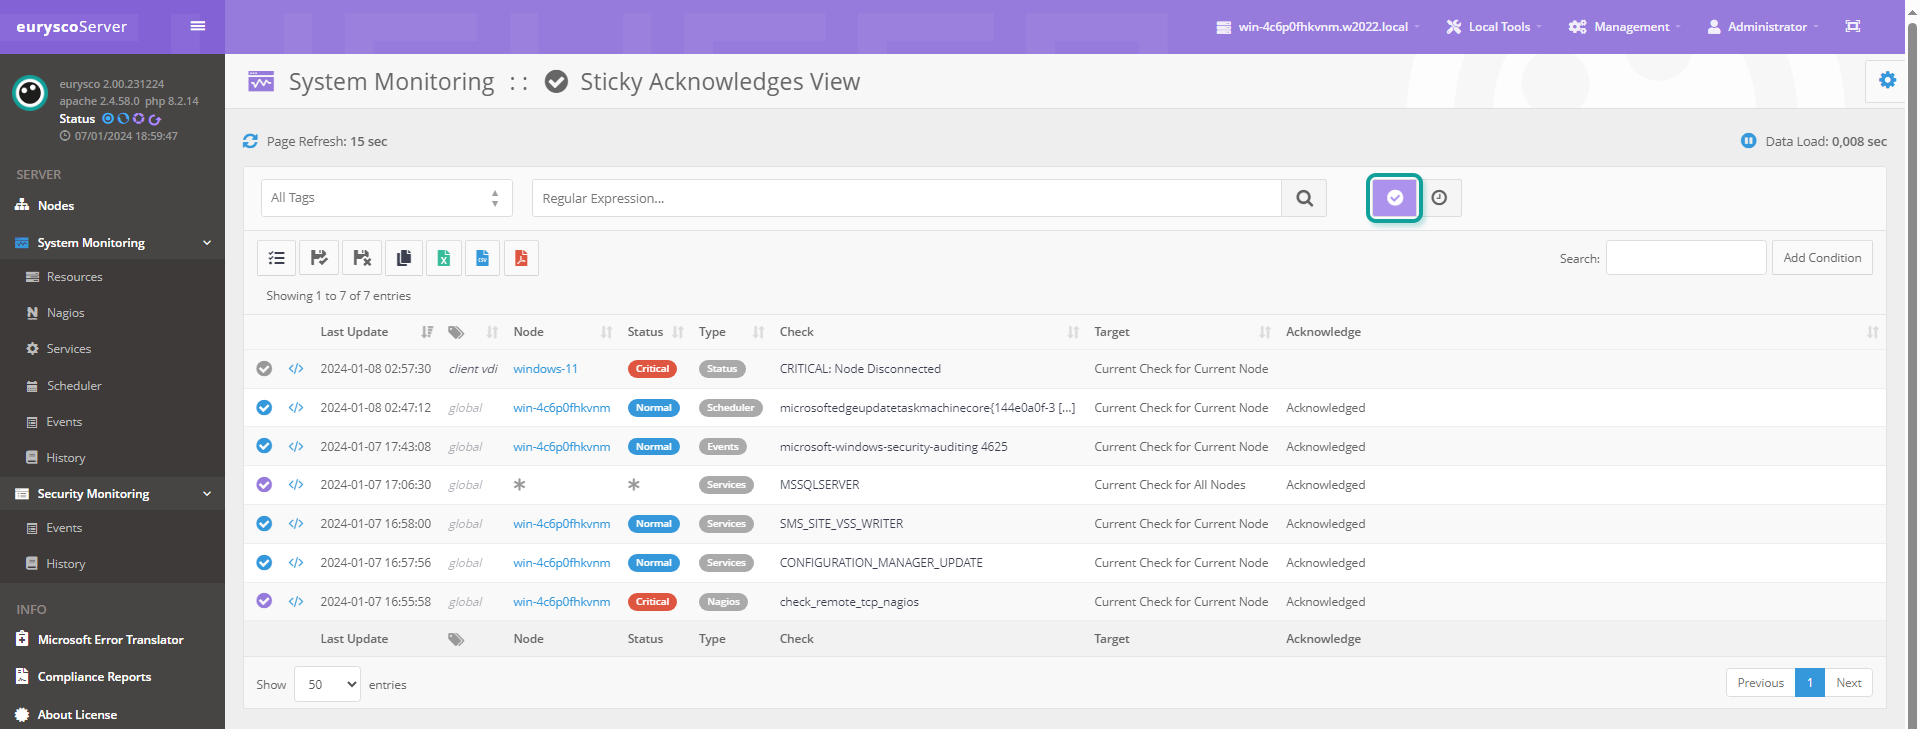
Sticky Acknowledges View #
Interface for managing active permanent acknowledges.
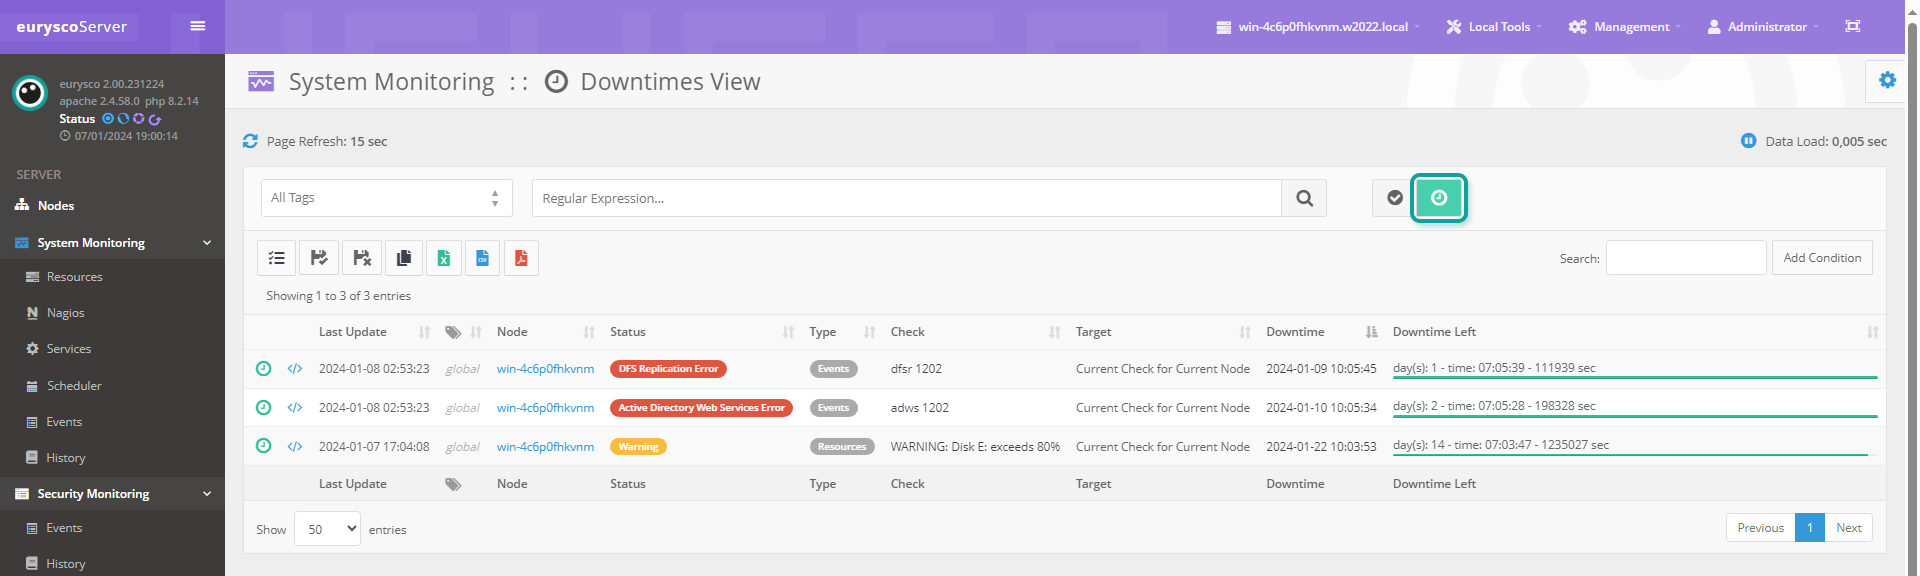
Downtimes View #
Interface for managing active downtime.
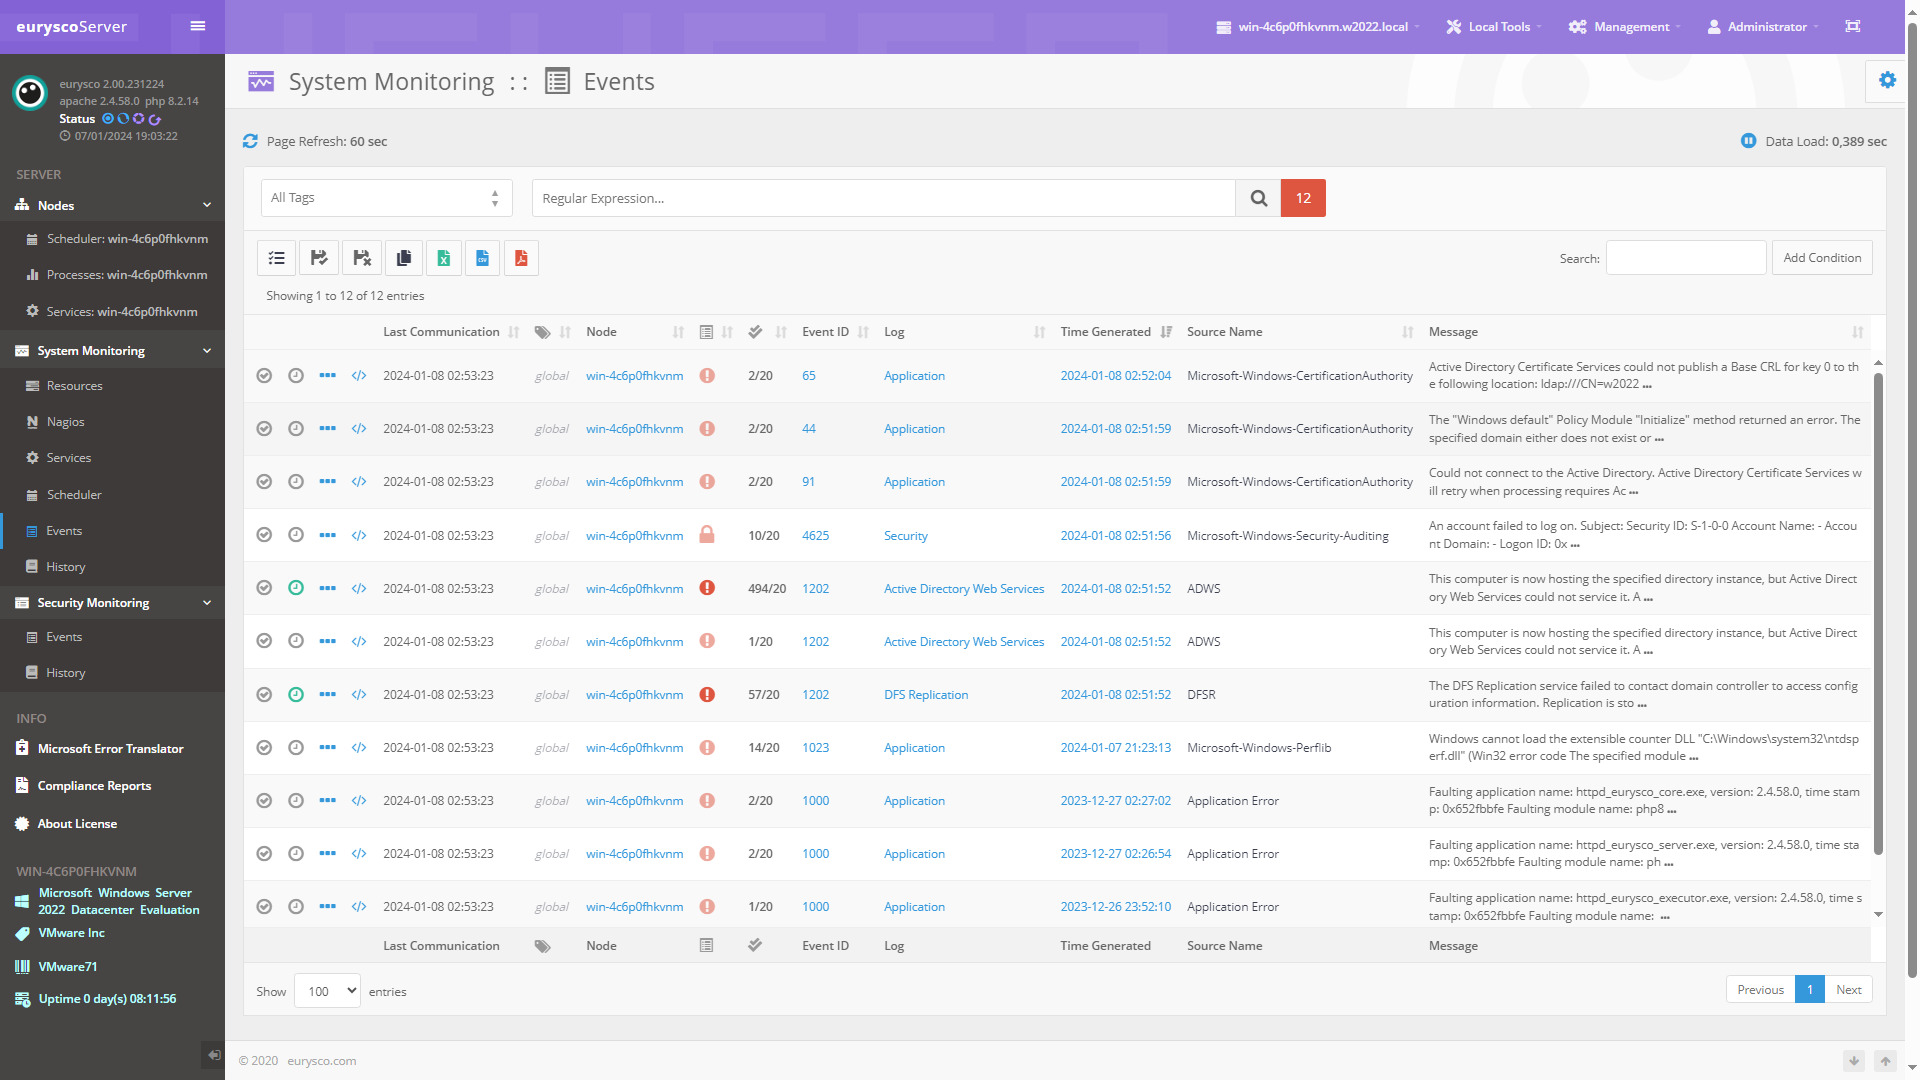
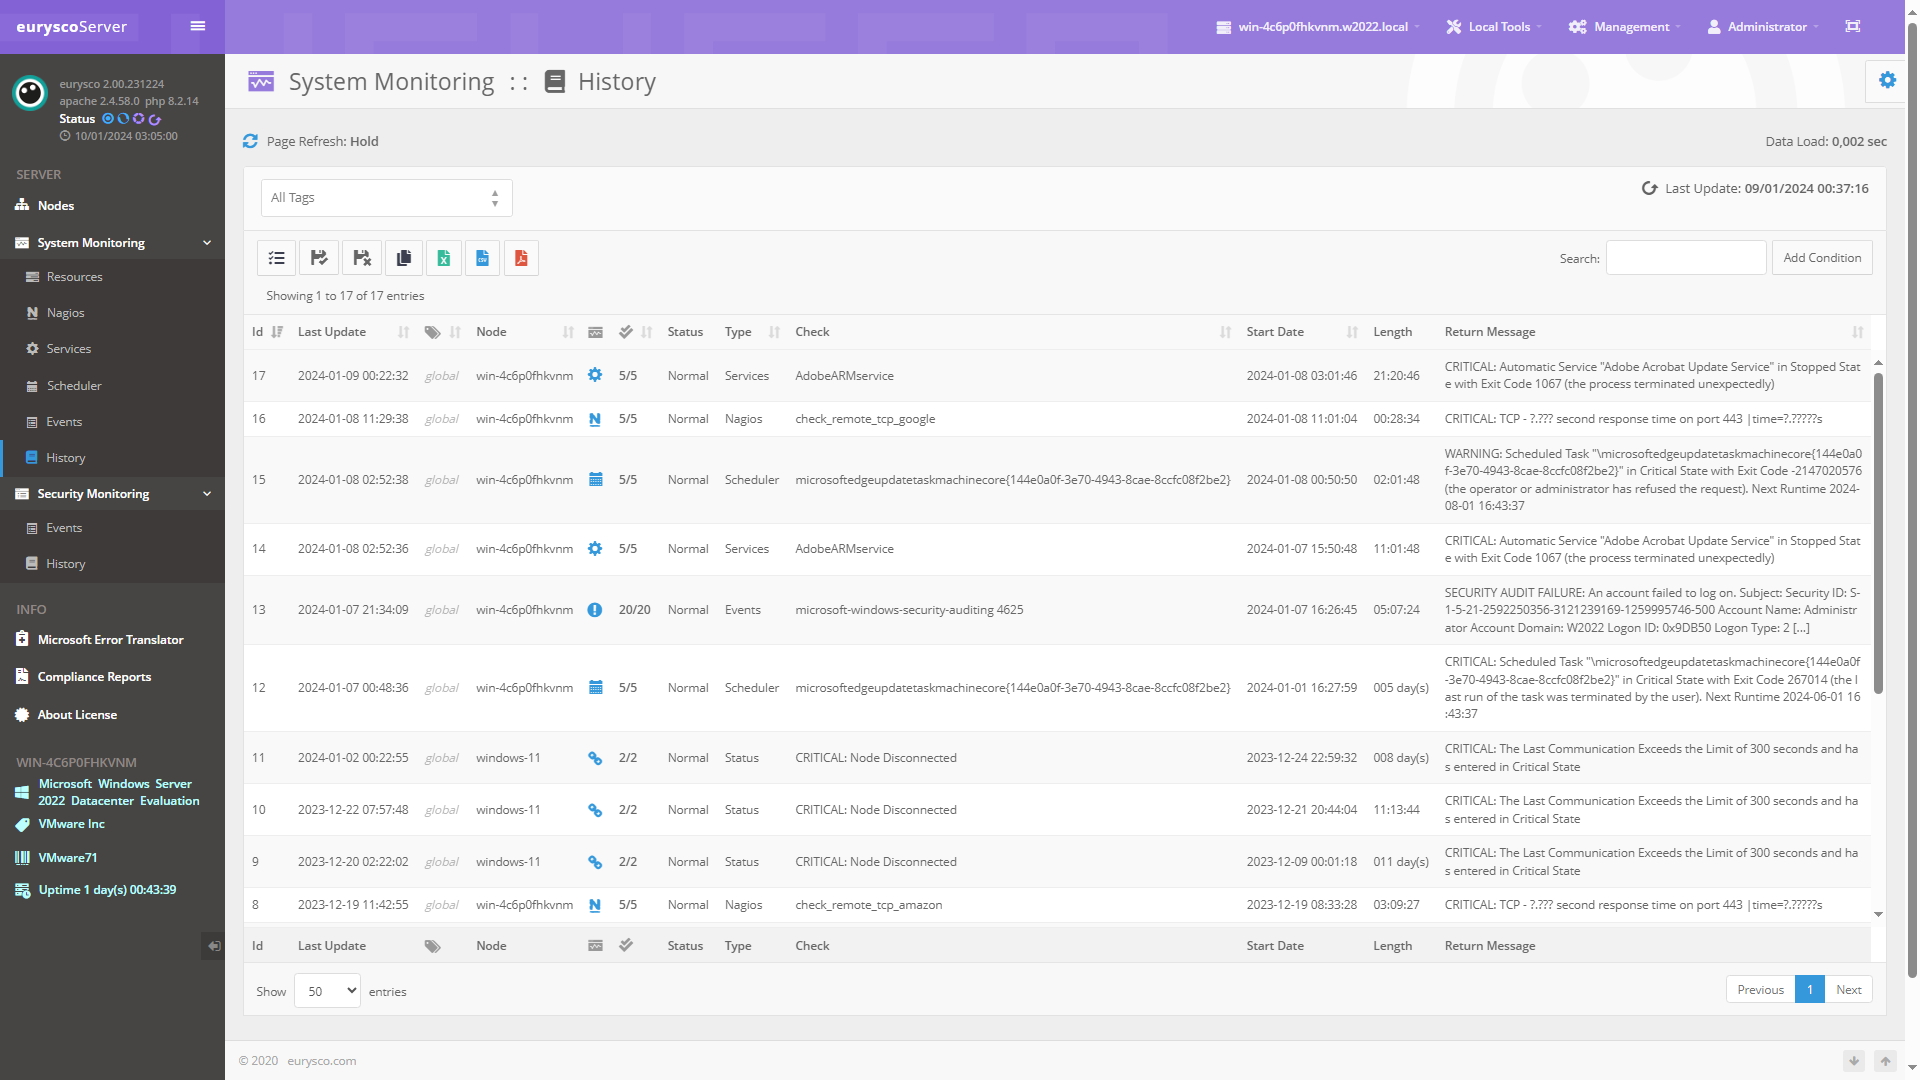
System Monitoring Details #
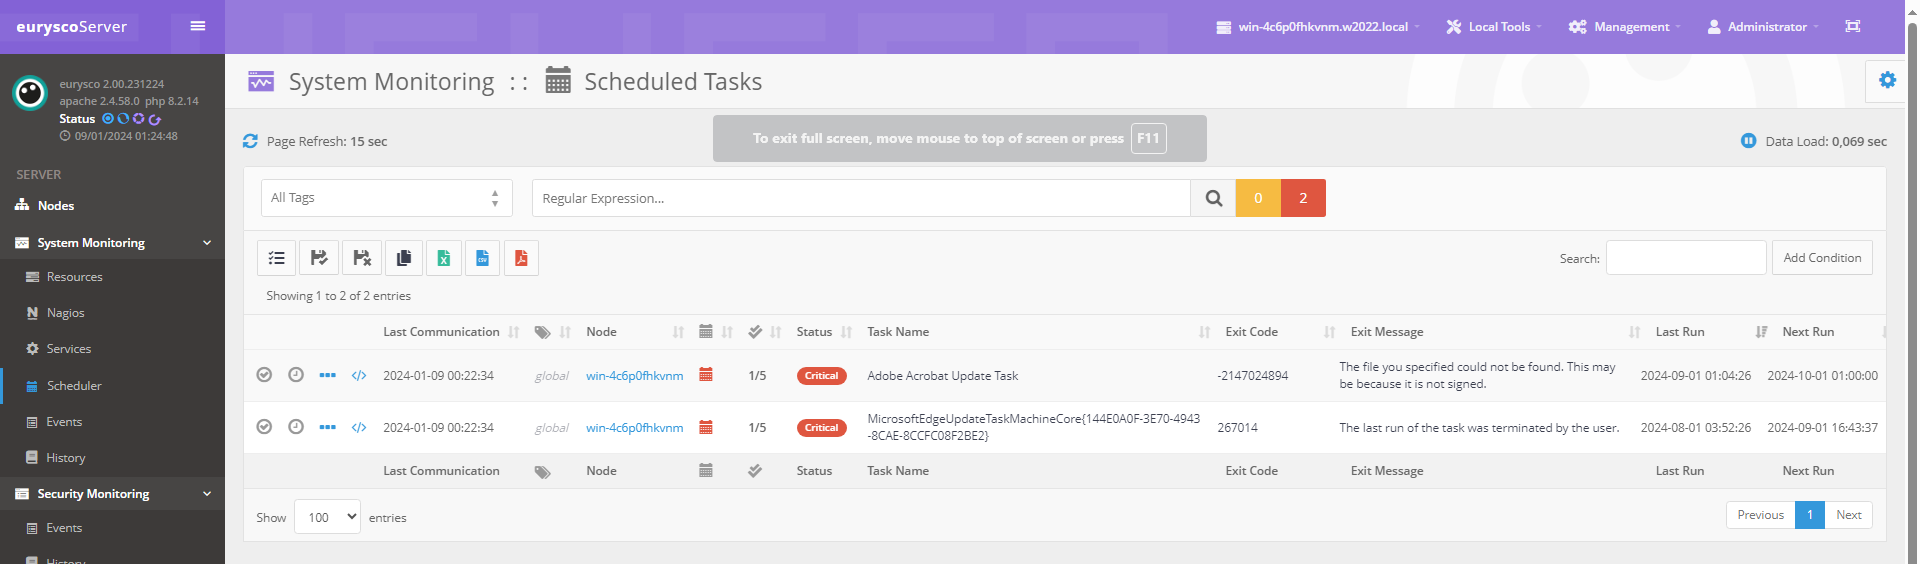
Specific views for each type of alarm which group together all the nodes and necessary management tools.